
Fuel is the single largest operating cost for Indian fleet owners. According to industry data, diesel, petrol, and CNG together account for approximately 45% of total fleet operating expenses on average. With diesel prices in Delhi hovering around ₹90–95 per litre in 2025–2026 following successive fuel hikes, every litre that leaks, gets stolen, or burns needlessly through poor driving disappears silently from the P&L.
India's road freight industry moves over 65% of the country's goods - nearly 2,300 billion tonne-kilometres annually. Behind that scale lie hundreds of thousands of trucks, tippers, tankers, and buses, each consuming hundreds of litres of diesel every month. For a 50-truck fleet running 3,000 km per vehicle per month at 4 km/litre, the monthly diesel bill can easily touch ₹35–40 lakh. A 15–20% reduction in that spend through a fuel monitoring system represents ₹6–8 lakh in monthly savings — or roughly ₹72 lakh to ₹1 crore per year.
Yet most fleet owners in India still rely on paper logs, driver self-reporting, and periodic reconciliation to manage fuel. The gap between what is filled and what is actually consumed gets quietly written off as "operational variance." This blog unpacks what that variance really costs, what a GPS fuel monitoring system saves per vehicle in verifiable rupee terms, and what the realistic ROI timeline looks like for Indian fleets of every size — from a 5-truck operator in Ludhiana to a 500-truck enterprise in Mumbai.
What Is a Fuel Monitoring System and How Does It Work?
A fuel monitoring system is a hardware-software solution that tracks real-time fuel levels, fills, theft events, and consumption patterns across an entire fleet. The hardware typically includes fuel sensors and GPS telematics devices; the software encompasses cloud dashboards, mobile apps, and analytics engines. The definition matters because not all systems are equal — and in Indian operating conditions, the difference between a basic float sensor and a fully integrated platform is the difference between a log and a live decision engine.
For Indian fleet operators, a modern system like fuel management system goes well beyond basic sensor readings. It uses flow meters and next-generation capacitance sensors for accurate fill measurements even while the vehicle is in motion — directly addressing the core weakness of traditional fuel level sensors, which produce inconsistent readings on moving vehicles due to fuel sloshing and tank geometry variations.
Key functional components of a full-stack GPS fuel monitoring system include:
- Real-time fuel level monitoring with per-litre accuracy, regardless of vehicle speed or road surface
- Automated fuel fill detection with GPS-tagged timestamps that create a verifiable digital trail for every fill event
- Theft and siphon alerts triggered by anomalous fuel drops exceeding a configurable threshold
- Idling time tracking correlated to excess fuel burn, logged by vehicle, driver, and geographic location
- Driver behaviour analytics covering harsh acceleration, hard braking, and overspeeding — each of which directly inflates fuel consumption per kilometre
- Route-level fuel efficiency reports identifying which routes or drivers consistently underperform on mileage
- Integration with GPS tracking, AIS-140 compliance, and ERP/TMS platforms so fuel data feeds into freight billing and load planning in real time
- Fuel P&L per vehicle, per route, and per driver — the output that enables cost decisions rather than just monitoring dashboards
How Fleetx's Fuel Monitoring System Works to Prevent Diesel Theft in Trucks
Fleetx replaces traditional fuel level sensors with flow meters and next-generation capacitance sensors that maintain accuracy regardless of terrain or vehicle movement. The data feeds into a centralised dashboard, providing fleet managers with a vehicle-wise P&L that maps fuel costs against maintenance costs, tire costs, and revenue per trip in a single view.
Three product capabilities distinguish Fleetx from basic GPS trackers in this space:
1. Direct integration with Indian fuel providers. Fleetx integrates natively with HPCL, BPCL, IOCL, and JIOBP - automatically reconciling pump fill records against what the vehicle sensor actually measured at fill time. If the pump invoice shows 200 litres but the sensor logged 183 litres entering the tank, the discrepancy is flagged immediately with a geo-tagged timestamp as evidence. Drivers can also upload fuel transactions directly through the Fleetx driver app, creating a shared, traceable record that replaces paper receipts entirely and builds accountability into everyday operations.
2. Idling location blacklisting. Rather than simply flagging idle events by duration, Fleetx allows fleet managers to blacklist specific depots, loading yards, or stop locations that consistently generate unnecessary idling. This converts a passive monitoring alert into an active operational policy - eliminating fuel waste at the source rather than just reporting it after the fact.
3. Real-time DTC alerts correlated to fuel consumption. Engine Diagnostic Trouble Codes that affect fuel efficiency — injector faults, turbocharger issues, exhaust system anomalies - surface as real-time alerts correlated with consumption data in the same view. A vehicle suddenly returning 3.1 km/litre instead of its baseline 4.2 km/litre triggers both a consumption flag and the associated DTC, enabling preventive maintenance before a fault escalates into a breakdown and missed trip.
"Fleetx has come up with a better fuel management system using advanced sensors instead of traditional fuel level sensors — because traditional sensors fail to give accurate measurements whenever the vehicle is in motion." — Fleetx Product Team
How Much Fuel Do Indian Fleets Actually Lose - The Hidden Bleed
Before calculating ROI, fleet owners need to understand exactly how much they are currently losing. Fuel loss in Indian fleets happens across three distinct channels - theft, inefficiency, and fraud - each with a separate financial signature and a separate remedy.
Fuel Theft and Pilferage
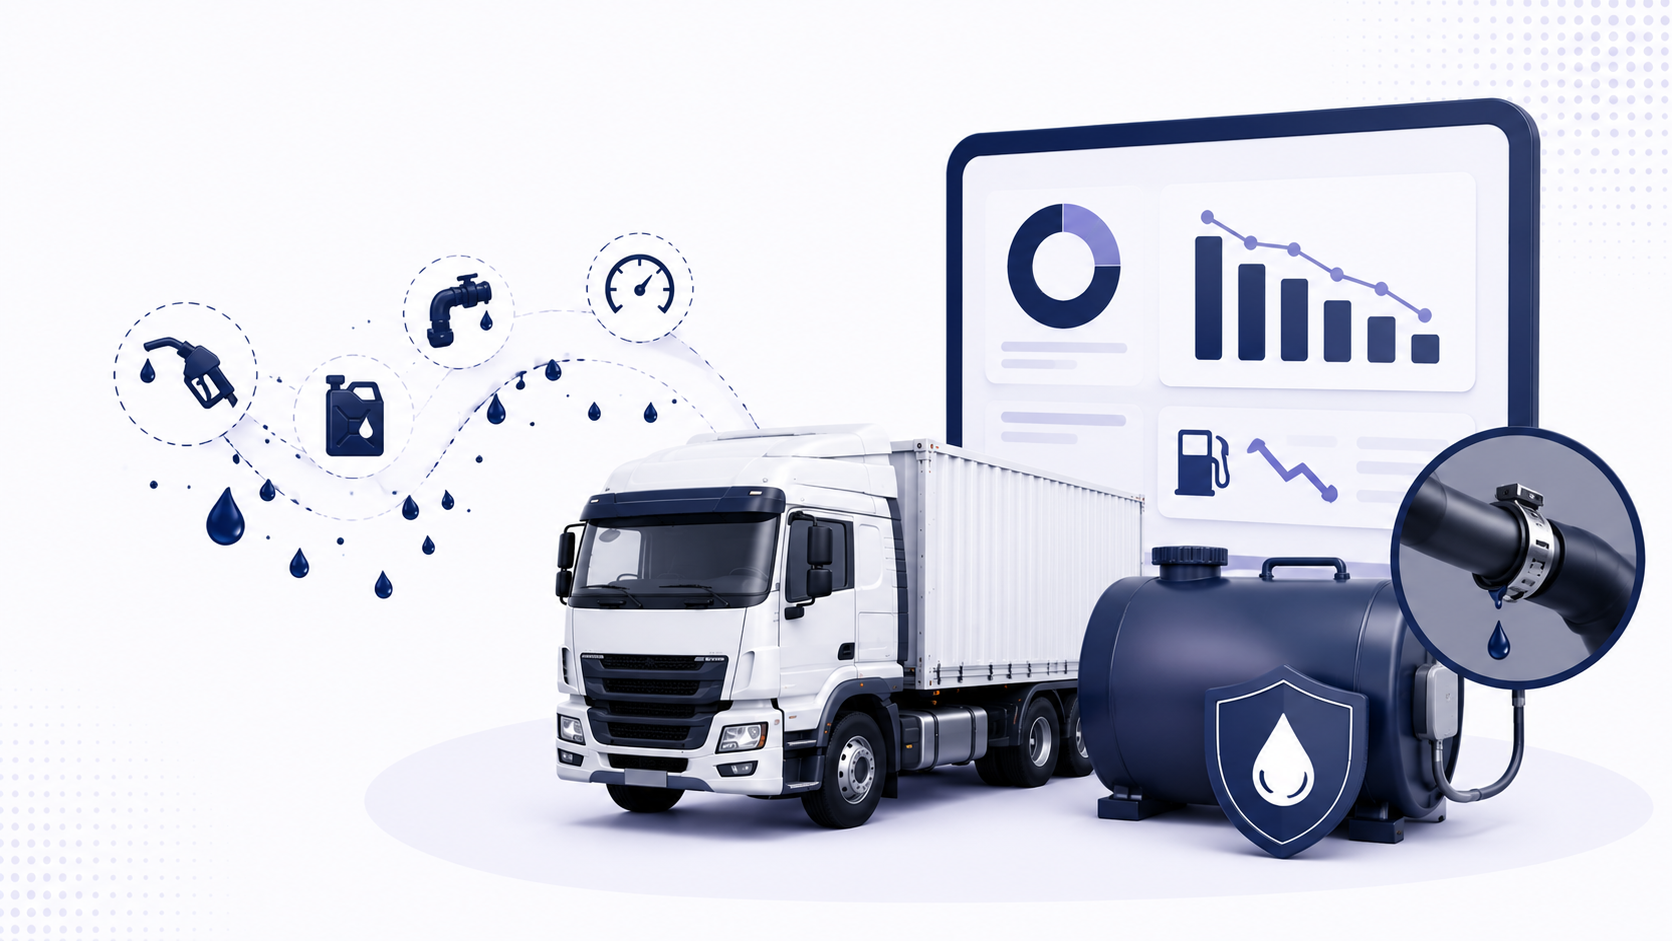
According to MotorIndia magazine, approximately 8% of all diesel filled in trucks gets stolen during transit in India. Industry figures from 2024 estimate ₹15,000–25,000 per truck per month in theft-related losses alone. For a 20-truck fleet, that adds up to ₹3–5 lakh every single month - losses that typically appear on the books as "operational variance" until GPS monitoring is installed.
Theft takes multiple forms across Indian operations:
- Short fuelling: The pump dispenses less diesel than the invoice states, with the driver and station attendant splitting the difference in cash
- Siphoning: Fuel is physically drained from the tank overnight or during scheduled stops at dhabas, border check-posts, or loading docks
- Duplicate billing: Drivers submit inflated or fabricated receipts — often from stations not issuing GST-compliant invoices, making verification impossible without sensor data
- Systematic collusion at fuel stations: Drivers and attendants coordinate to underfill consistently across multiple trips at agreed-upon stations
- After-shift draining: Operators drain excess fuel from machines before sign-off - a pattern especially common in construction and mining fleets working on remote sites
Fuel Inefficiency from Driver Behaviour
Beyond direct theft, driver behaviour adds a further 10–15% to fuel costs through avoidable waste. A 2022 Fuel ROI Report - one of the most comprehensive telematics studies of its kind - found that top-performing fleets using driver coaching achieved a 13% reduction in fuel consumption, with a 79% reduction in hard acceleration events, 40% reduction in hard braking, and 20% reduction in idling time.
In Indian conditions, where trucks routinely idle at toll plazas, state border check-posts, weighbridges, and loading docks, idling losses alone account for 8–12% of total diesel consumption. A truck idling just two hours per day across 25 working days wastes 75–125 litres per month - equivalent to ₹6,900–11,500 in diesel at current prices per vehicle. Multiplied across 50 trucks, the idle-only monthly loss reaches ₹3.5–5.75 lakh.
Fuel Fraud in the Supply Chain
Fleet managers in the US are already familiar with this math. A 1,000-vehicle fleet with $5M in annual fuel spend and a $10M operating budget is quietly hemorrhaging around $500K every year - not to market volatility, not to rising diesel prices, but to drivers topping off personal vehicles and submitting inflated fuel reports. That's 5% of total operating cost, gone. Not in one dramatic fraud event, but in dozens of small, invisible transactions across hundreds of routes, every single day.
In Indian fleets, supply-chain fraud - where drivers, station attendants, or depot staff manipulate records. Fuel card data alone cannot detect this: only in-vehicle sensor data cross-referenced against pump records can close the gap.
What Is the Realistic Per-Vehicle Saving from a Fuel Monitoring System in India?
This is the question every fleet owner asks - and the answer depends on fleet size, route type, baseline fuel loss level, and the system deployed. Here is a data-driven breakdown across three scenarios built on publicly verified benchmarks.
| Metric | 📦 Baseline Typical Long-Haul Truck |
🟡 Conservative 15% Reduction |
🟠 Moderate 20–25% Reduction |
🔴 High-Impact 30%+ Reduction |
|---|---|---|---|---|
| Avg. Diesel Consumption | 4 km/litre | — | — | — |
| Monthly Distance | 5,000–8,000 km | — | — | — |
| Monthly Diesel Consumption | 1,250–2,000 litres | 1,500 litres* | 1,500 litres* | 1,500 litres* |
| Monthly Fuel Cost / Truck | ₹1,15,000–₹1,84,000 | ₹1,15,000 | ₹1,38,000* | ₹1,38,000* |
| Annual Fuel Cost / Truck | ₹13.8 lakh–₹22 lakh | — | — | ₹16.56 lakh* |
| Monthly Saving / Truck | — | ₹17,250 | ₹25,300 (at 22%) | ₹41,400+ (at 30%) |
| Annual Saving / Truck | — | ₹2,07,000 (~₹2.1 lakh) | ₹3,03,600 (~₹3 lakh) | ₹4,96,800+ (~₹5 lakh) |
| Saving for 50-Truck Fleet | — | ₹1.03 crore/yr | ₹1.52 crore/yr | ₹2.48 crore+/yr |
| Best Suited For | All highway fleets | General logistics, mixed routes | Full-stack GPS + driver analytics | Mining, construction, tanker fleets |
| * Assumptions: Monthly diesel consumption = 1,500 litres/truck; diesel price = ₹92/litre. IFTRT 2024 data used for conservative and moderate benchmarks. High-impact figures derived from Gujarat construction fleet and 120-truck logistics fleet case studies. | ||||
What Does a Fuel Monitoring System Cost in India?
Understanding ROI requires knowing the full cost of deployment. For Indian fleets, total cost of ownership (TCO) covers hardware, installation, SaaS subscription, and ongoing support.
Typical Cost Components
- Hardware (fuel sensor + telematics device): ₹8,000–18,000 per vehicle (one-time)
- Installation: ₹1,500–3,000 per vehicle (typically under 2 hours per vehicle)
- Monthly SaaS subscription: ₹800–2,500 per vehicle per month
- AIS-140 compliant GPS device (if not already fitted): ₹3,000–8,000 per vehicle (one-time)
- Annual maintenance and support: typically included in the subscription fee
Total Cost of Ownership: First Year Per Vehicle
- Hardware and installation: ₹10,000–21,000 (one-time)
- Annual software subscription: ₹9,600–30,000
- Total first-year cost per vehicle: ₹20,000–51,000
- Annual recurring cost from Year 2: ₹9,600–30,000 per vehicle
An important point on hardware: most modern fuel monitoring solutions — including Fleetx — are built on AIS-140 compliant telematics hardware, which is already mandatory for all commercial vehicles in India. Fleet owners who have not yet deployed AIS-140 devices can achieve regulatory compliance and full fuel monitoring through a single hardware installation, eliminating the need for separate investments.
Larger fleets benefit from volume pricing on hardware and subscriptions. ROI figures are net of total first-year system cost including hardware.
Use the step-by-step ROI formula in the section below to calculate your fleet's specific payback period - or explore Fleetx's fuel management system to request a savings estimate based on your fleet size and route profile.
Typical Cost Components
| Cost Item | Type | Amount per Vehicle | Note |
|---|---|---|---|
| Hardware (fuel sensor + telematics device) | One-time | ₹8,000–₹18,000 | — |
| Installation | One-time | ₹1,500–₹3,000 | Typically under 2 hours per vehicle |
| Monthly SaaS subscription | Recurring | ₹800–₹2,500/month | — |
| AIS-140 compliant GPS device (if not already fitted) | One-time | ₹3,000–₹8,000 | Mandatory for all commercial vehicles in India |
| Annual maintenance & support | Included | ₹0 | Typically bundled in subscription |
Total Cost of Ownership & ROI Payback Calculator
| Step | What to Calculate | Formula | Example (50-truck fleet) |
|---|---|---|---|
| 1 | Monthly fuel spend | Trucks × monthly litres/truck × ₹/litre | 50 × 1,500 × ₹92 = ₹69,00,000/month |
| 2 | Preventable monthly loss | Monthly spend × 20% loss rate (IFTRT 2024) | ₹69,00,000 × 20% = ₹13,80,000/month |
| 3 | Total first-year system cost | Trucks × (₹25,000 hardware + ₹18,000 annual subscription) | 50 × ₹43,000 = ₹21,50,000 |
| 4 | Payback period | Total first-year cost ÷ monthly preventable loss | ₹21,50,000 ÷ ₹13,80,000 = ~6–8 weeks |
| 5 | Year 2+ net annual ROI | (Monthly saving × 12) − annual subscription cost | (₹13,80,000 × 12) − (₹18,000 × 50) = ₹75,60,000 net/yr |
| TCO ranges: Hardware + installation ₹10,000–₹21,000 (one-time) · Annual subscription ₹9,600–₹30,000 · Total first-year cost per vehicle: ₹20,000–₹51,000 · Year 2+ recurring: ₹9,600–₹30,000/vehicle. Larger fleets benefit from volume pricing. ROI figures are net of total first-year system cost including hardware. | |||
Fleetx Fuel Monitoring System: Features, Client Results, and What Sets It Apart
Fleetx is one of India's leading fleet and transportation management platforms, serving some of the country's largest logistics organisations with an integrated, AI-powered fleet management suite. The Fleetx fuel management system is engineered specifically for Indian operating conditions — not adapted from a Western telematics product.
Core Features
Central Control Tower: Real-time fuel level visibility across the entire fleet from a single dashboard. Fleet managers see every vehicle's current fuel level, recent fill events, consumption trends, and anomalies without switching views or waiting for end-of-day reports.
Vehicle-wise fuel P&L: Fuel costs mapped against maintenance costs, tyre costs, and trip revenue — giving fleet owners a true per-vehicle profitability picture, not just a consumption log.
Next-generation sensors: Flow meters and capacitance sensors replace traditional fuel level sensors, maintaining accuracy regardless of vehicle speed, road condition, or tank geometry. This eliminates the primary failure point of older systems, which renders their fuel records unreliable and non-auditable.
GPS-integrated fill tracking with fuel provider reconciliation: Every fill is logged with location, time, and volume. Fleetx integrates directly with HPCL, BPCL, IOCL, and JIOBP, automatically reconciling pump records against what the vehicle sensor captured. Any discrepancy above a configurable threshold — for example, more than 2 litres — triggers an immediate alert with geo-tagged evidence ready for driver or station follow-up. Drivers can additionally upload fuel transactions via the Fleetx driver app, replacing paper receipts with a traceable shared digital record.
Driver behaviour module with performance scoring: Idling time, harsh acceleration, hard braking, and overspeeding are tracked and scored per driver, per trip, and per route. Fleet managers can run data-backed coaching sessions, set policy thresholds, and implement performance-linked incentives. Because drivers access their own scores through the Fleetx driver app, monitoring becomes collaborative — drivers are participants in the system rather than subjects of it.
Idling location blacklisting: Beyond flagging idle events by duration, Fleetx allows managers to blacklist specific locations — loading yards, dhaba stops, state border check-posts — that consistently generate unnecessary idling. This converts a monitoring alert into an operational policy that reduces fuel waste at the source.
Proactive maintenance via DTC correlation: Real-time Diagnostic Trouble Code alerts surface engine faults affecting fuel efficiency — injector issues, turbocharger faults, tyre pressure anomalies — correlated with fuel consumption data in the same view. A vehicle consuming abnormally high fuel triggers both a consumption alert and the relevant DTC, enabling preventive workshop action before a breakdown pulls the vehicle off-route.
AIS-140 compliant hardware: Meets the Indian government's mandatory commercial vehicle GPS tracking standard, so fleet owners achieve compliance and fuel monitoring through a single hardware deployment.
Multi-modal TMS integration Fuel data feeds into load planning, freight billing, e-way bill management, and route optimisation — making fuel performance a live input to commercial decisions, not a monthly report reviewed in hindsight.
Documented Client Results
Shivani Carriers deployed Fleetx's live tracking and driver behaviour monitoring and recorded a 30% reduction in overspeeding events alongside a 20% improvement in overall fleet visibility — improvements that fed directly into measurable fuel savings on their routes. The Fleetx platform is deployed across fleets ranging from 10 vehicles to enterprise operations with thousands of assets across India.
Learn more about Fleetx's fuel management system →
How to Calculate Fuel Monitoring ROI for Your Fleet: A Step-by-Step Formula
You do not need a consultant to calculate whether a GPS fuel monitoring system makes financial sense for your fleet. Use this five-step framework with your own numbers.
Step 1 — Estimate your current monthly fuel spend
Trucks in fleet × monthly diesel consumption (litres) × current diesel price (₹/litre) = Total monthly fuel spend
Example: 50 trucks × 1,500 litres × ₹92 = ₹69,00,000/month
Step 2 — Apply a conservative loss rate
Apply 20% as the minimum realistic combined loss rate (theft + inefficiency, per IFTRT 2024 data):
Example: ₹69,00,000 × 20% = ₹13,80,000/month in preventable losses
Step 3 — Estimate your system cost
Hardware and installation (₹25,000/vehicle one-time) + annual subscription (₹18,000/vehicle):
Example: 50 vehicles × ₹43,000 = ₹21,50,000 total first-year cost
Step 4 — Calculate your payback period
Total first-year cost ÷ Monthly preventable loss = Payback in months
Example: ₹21,50,000 ÷ ₹13,80,000 = 1.56 months ≈ 6–8 weeks
Step 5 — Calculate Year 2+ annual ROI
Annual saving minus recurring annual subscription:
Example: (₹13,80,000 × 12) − (₹18,000 × 50) = ₹1,65,60,000 − ₹9,00,000 = ₹75,60,000 net annual gain from Year 2, at conservative estimates — before compounding savings from sustained driver behaviour improvement
The maths hold consistently across fleet sizes. Payback shortens as fleet size grows, but even a single-truck operator reaches breakeven within the first quarter at these cost and saving levels.
What Features Should Indian Fleet Owners Prioritise When Choosing a Fuel Monitoring System?
Not all fuel monitoring systems are designed for Indian operating realities. Based on the specific challenges of Indian logistics — fuel adulteration, short fuelling, AIS-140 compliance, GST-compliant receipt requirements, multi-language driver interfaces, and regional diesel price variation — here is a practical evaluation checklist.
Non-negotiable requirements:
- AIS-140 compliant hardware — mandatory for commercial vehicles and should come standard, not as a paid add-on
- Real-time fuel sensor with motion-accurate readings (flow meters or capacitance sensors, not basic float sensors)
- GPS-integrated fill event geo-tagging with timestamp for every fill, not just anomalies
- Automated short-fuelling and siphon alerts with configurable thresholds
- Direct integration with Indian fuel providers (HPCL, BPCL, IOCL, JIOBP) for automatic transaction reconciliation
- Driver behaviour analytics covering idling, harsh acceleration, hard braking, and overspeeding
- Vehicle-wise fuel P&L mapped against maintenance costs and trip revenue
- Driver-facing mobile app so monitoring is a shared tool rather than one-way surveillance
- ERP/TMS integration and e-way bill compatibility for compliance-ready record-keeping
- Multi-fuel support covering diesel, CNG, and petrol for mixed fleet operators
Features that distinguish enterprise-grade platforms:
- Idling location blacklisting, not just idle event duration alerts
- Real-time DTC alerts correlated with fuel consumption anomalies for predictive maintenance
- Central Control Tower view across the full fleet in a single dashboard
- Fleet-wide driver efficiency rankings with automated coaching report delivery
- Fuel provider transaction reconciliation at the individual fill level
Fleetx's fuel management system covers every item on both lists natively, built on AIS-140 compliant hardware with direct Indian fuel provider integrations and a driver app designed for Indian fleet operations on the ground.
Common Objections - and Why They Don't Hold Up
"Our drivers will resist monitoring."
This is the most frequently cited reason for delaying deployment — and the one that costs fleet owners the most in the interim. Monitoring data, used well, is a coaching tool rather than a surveillance mechanism. When drivers access their own fuel efficiency scores through the Fleetx driver app, see that better driving leads to fewer breakdowns and more trip allocations, and log their own fuel fills through the same app to share accountability, adoption improves substantially. The driver app makes them active participants in the system rather than passive subjects. That framing shift changes the conversation on the workshop floor.
"We already use fuel cards. Isn't that enough?"
Fuel cards record what the pump invoiced - not what physically entered the tank. They cannot detect short fuelling, post-fill siphoning, or idling waste. The gap is structural: a card captures a transaction, not a measurement. A GPS fuel monitoring system provides in-vehicle sensor data entirely independent of the pump record. When Fleetx integrates directly with HPCL, BPCL, IOCL, and JIOBP, the two data streams are reconciled automatically. Any discrepancy above the threshold is flagged immediately, with geo-tagged evidence usable in driver conversations or fuel station dispute resolution.
"The data is too complex to act on."
Modern platforms like Fleetx surface only what needs attention, not everything at once. Pre-built anomaly alerts, weekly driver efficiency rankings, automated per-vehicle P&L reports, and DTC-linked maintenance flags mean fleet managers need no data expertise to act. The system identifies which vehicle is overconsuming, which driver idles excessively, which station shows a consistent short-fuelling pattern — and provides the evidence to act on each of those within minutes.
What Is the Realistic Saving Per Vehicle for Indian Fleet Owners?
Based on all available industry data, independent research, and documented case studies from Indian fleet deployments, here is the consolidated answer:
- Minimum realistic saving: ₹1.5–2.1 lakh per truck per year (15% fuel cost reduction)
- Most likely outcome: ₹2.1–3.5 lakh per truck per year (18–25% reduction, consistent with IFTRT 2024 benchmarks)
- High-impact scenarios: ₹3.5–4.8 lakh per truck per year (25–35%, for mining, construction, and tanker fleets)
- Payback period on system investment: 2–6 months for most Indian fleets
- Year 2+ net annual ROI per vehicle (after subscription costs): ₹1.1–3.5 lakh
- For a 50-truck fleet: ₹1 crore to ₹1.75 crore in annual savings
The Indian trucking industry operates on notoriously thin margins - where a 1–2% swing in fuel efficiency determines whether a fleet ends the year in profit or loss. A GPS fuel monitoring system is not a technology upgrade. It is a profit protection investment with some of the most predictable, measurable, and rapid returns available to Indian fleet owners today.
With diesel prices continuing to rise, AIS-140 compliance already mandating telematics hardware across all commercial vehicles, and platforms like Fleetx offering vehicle-wise fuel P&L with direct fuel provider integrations, the question is no longer whether fleet owners can afford to implement fuel monitoring. It is how much longer they can afford not to.
Frequently Asked Questions About Fuel Monitoring Systems in India
- Best fuel monitoring system in India
- Fuel monitoring system price in India
- How to stop diesel theft in trucks
- GPS fuel sensor cost
- Truck fuel monitoring software
- How to reduce fuel cost in logistics
- Fuel management software for transport companies
- Fleet fuel monitoring system ROI
- How to monitor truck diesel usage