

If you are a transporter who owns fleet vehicles, reducing fleet expenses should be your first priority. However, fleet managers also need to be aware of the vehicle operating costs involved. The route and expense budget for the business, as well as data analyses of productivity and revenue, all depend heavily on fleet expense analysis. It is critical to understand the cost per kilometer that each vehicle travels.
The best method to make data-driven decisions to maximize profitability is through fleet expense analysis. It is simple to track expenses and centralize the data when using software. Fleet managers will benefit from fleet expense analysis and get a realistic perspective on budgeting and profitability. It will also help them run their transport operations more effectively if they have optimized and regulated costs. Today, as part of our blog series on fleet manager reports, we'll start with a discussion of how to analyze fleet expenses effectively and efficiently.
Fleet Cost Optimization Supports National Logistics Modernization
Fleet cost optimization is no longer just a business objective—it also aligns with India's broader transportation modernization initiatives. Government agencies continue to encourage digital technologies that improve road safety, vehicle efficiency, compliance, and logistics productivity.
Fleet operators implementing GPS tracking, preventive maintenance, digital expense management, FASTag integration, and fleet analytics are better positioned to improve operational efficiency while complying with evolving transportation standards.
For additional guidance on national road transport policies and commercial vehicle regulations, fleet managers can refer to:
- Ministry of Road Transport & Highways (MoRTH)
- National Highways Authority of India (NHAI)
- FASTag / National Electronic Toll Collection (NETC)
- Parivahan Digital Services
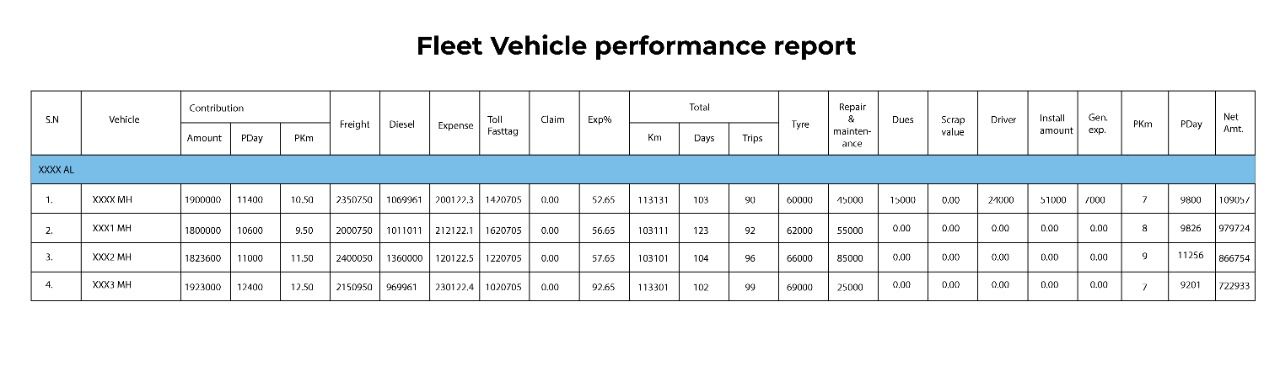
In any business that deals with import exports and transportation, vehicle performance is the most crucial thing because it provides an overall picture of what's happening in the company and provides overall visibility of the vehicle. But having the vehicle performance data has many steps; it is a combination of various processes that we are going to discuss today in this blog. Before starting, it is important to note that the expense cost structure is divided into two parts: direct expense and indirect expense.
Direct Expenses
Analytical report: If we start talking about vehicle movements or trips and look at a defined vehicle and how many kilometers it has covered, then the kilometers traveled by it can be measured by three parameters, and these three comparisons are calculated in the following way:
- The difference in odometer readings from the beginning to the end of the journey
- Route planned distance and configured total distance traveled during the travel period
- GPS device value for total distance traveled.
The measuring parameter is chosen by the fleet managers according to their requirements. Once in a month, fleet owners check the three different parameters and compare them. This is called an analytical report, and if there is a minor variation in the report, it is manageable, but if there are more, action should be taken for the inaccuracies as it leads to expenses.
Running-based expense report: A running-based expense report depends on many factors, but here are four reasons listed that are common factors for all the expenses in a business.
Loaded and unloaded trips: There are two types of trips: loaded trips, in which trucks carry cargo, and unloaded trips, in which trucks travel empty. In defined kilometers, the number of trips the vehicle has completed accounts for income and expenses. The expenses and income are calculated according to the number of loaded and unloaded trips made. If the unloaded trips are more than the expected number, then the management has to take action to reduce them.
Vehicle Model-Wise: Vehicle efficiency increases the revenue directly. If the vehicle model is good, it tends to perform better, which helps in saving costs. Also, a better vehicle model requires less maintenance and provides better features.
Driver Wise: All vehicles must cover a certain number of kilometers per day according to a given benchmark; if they exceed that, the driver should be rewarded; otherwise, they should be penalized if they do not meet the benchmark. This impacts the driver's performance and accounts for vehicle expenses.
Driver Group Wise: There are defined areas where the drivers are efficient. The company should know who they can rely upon and they should select a group of drivers who are capable of giving on-time deliveries and who follow ETAs. On the other hand, companies should also examine the drivers who are exceeding ETAs. They should perform a proper analysis of quarter-wise driver performance, driver shuffles, better driver recruitment, and bad driver removal. Decision-making according to the driver's past experience is important for saving costs.
Business expense: Expenses can be incurred in the revenue according to the trip route, region, destination, and vehicle model. We can determine which regions are profitable and which regions require more attention by analyzing revenue.
When there is no deduction in the cost, the amount of freight that is safely and timely delivered is revenue for the company; however, if there is a loss due to any factor, management must calculate why and where the deduction is.
Market vehicle expense: There are two ways a vehicle can be used: one by leased, and the other is own vehicle. With the report and the data, we can analyze which type of vehicle is profitable for the company and know the estimated expense that can occur. For instance, if in some states, businesses can't afford the availability of their own trucks, then they can go for leasing trucks in that region which can help them in saving the cost of the long trips, fuel, driver wages, and maintenance expenses.
Trip and miscellaneous expenses: When moving materials from one place to another, expenses like delivery charges, fuel, challans, toll expenses (cash or FASTag ), and miscellaneous charges etc. , all of these are counted as expenses. Companies can use the data to conduct regional analyses by comparing trip expenses of different regions. Some fleet managers add fuel and toll taxes to their expenses, and some do not.
The budget is determined when planning a trip, and once the results are in, we can analyze the expenses and try to reduce them. While planning a trip, an estimated amount of fuel (CNG, diesel, or gasoline) is decided, and based on a defined average, the fleet owners record the budget vs. actual fuel requirement and then come to the conclusion that they are at a profit or not. All the expenses are calculated and compared to the estimated expense.
Indirect Expenses
The vehicle is not as closely tied to indirect expenses and doesn’t account for leased vehicles. They are generic business expenses that we cannot immediately link to a specific vehicle because they serve the needs of the entire organization. We have covered some general indirect expenses that a fleet manager deals with on a regular basis.
Tyres: Trip expenses such as tyres, scrap tyre exchange, and torn tyre tread are indirect expenses. The scrap value of the tyre adds up in the company's account, which is why it is important to keep track of how many times tyres are changed and sold.
For instance, if vehicle 1 tyre works for 3 months and it breaks down and tyre 2 is put on from stocks and the old tyre is sold, then the income will be indirect income, and in a calculation, if we consider the tyre value to be ₹15,000 but we get ₹500 back when it is sold, then the expense will be considered to be ₹14,500.
Repair and maintenance: Repair can be done in two ways:
- In-house maintenance: It is carried out on company premises where a workshop has been established and the work can be completed using company resources.
- Outsource maintenance—work is done outside, and repair work is outsourced.
In both cases, the repair expense is different. The company must determine the best repair method for each piece of equipment. Clients follow both practices because not all the maintenance equipment is available in companies and because it can be easily done by outsourcing.
Fleet owners can calculate generic or routine maintenance costs, en-route maintenance, accidental maintenance, and capital investment (purchase cost of the vehicle, modification cost, new vehicle accessories to bring the vehicle on the road, body changes based on the client's needs or government norms) using fleet expense data analysis.
If the cost of maintenance is significantly increased by an accident, then fleet owners need to take action against the cause of the accident.
General expenses: General expenses are not part of the above-mentioned expenses; they can be anything like staff salaries, office expenses, or the EMIs of vehicles owned and documentation (If documentation expenses are high, then in the report we can check and compare other agents' expenses); the deduction of such expenses from revenue results in the deduction of net profit of the company. Net profit can be calculated on a daily, weekly, or monthly basis, depending on the vehicle.
Through reports, we can see which areas are costing more and where companies can save money. If general maintenance costs are high, it’s a challenge for the companies, and this cost can be used to check the flow of expenses.
Key Fleet Cost Optimization KPIs Every Fleet Manager Should Track
Fleet expense analysis becomes significantly more valuable when every operational cost is tied to measurable Key Performance Indicators (KPIs). While analysing direct and indirect expenses is essential, monitoring the right KPIs enables fleet managers to identify trends early, benchmark vehicle performance, and make informed decisions before costs escalate.
Instead of reviewing expenses only at the end of the month, successful transport companies monitor these metrics continuously. This proactive approach helps reduce operating costs while improving vehicle utilization, profitability, and customer satisfaction.
Essential Fleet Cost Optimization Metrics
| KPI | Why It Matters | Target for Efficient Fleet Operations |
|---|---|---|
| Cost Per Kilometre (CPK) | Measures the total operating expense for every kilometre travelled | Should remain stable or decrease over time |
| Fuel Cost Per Trip | Identifies routes or vehicles consuming excess fuel | Compare against planned fuel budget |
| Vehicle Utilization Rate | Indicates how effectively fleet assets are being used | Higher utilization with minimal idle time |
| Empty Running Percentage | Shows revenue loss caused by unloaded trips | Keep below 10–15% wherever possible |
| Maintenance Cost Per Vehicle | Detects vehicles with increasing repair expenses | Monitor monthly trends |
| Driver Performance Score | Links driving behaviour to operating costs | Encourage safer, fuel-efficient driving |
| Average Downtime | Measures revenue lost due to breakdowns | Minimize through preventive maintenance |
| Revenue Per Vehicle | Evaluates profitability of each fleet asset | Should increase alongside utilization |
Why These KPIs Matter
Monitoring these indicators allows fleet managers to:
- Detect abnormal increases in fuel consumption before they become costly.
- Identify vehicles that require replacement due to excessive maintenance.
- Compare profitability across routes, customers, vehicle models, and regions.
- Improve budgeting accuracy using historical operating data.
- Reduce unnecessary operating expenses through preventive decision-making.
- Increase fleet availability without purchasing additional vehicles.
- Support data-driven negotiations with customers and transport partners.
Using KPI Dashboards for Better Decision Making
Modern fleet management software automatically converts GPS data, fuel transactions, maintenance records, and trip reports into easy-to-understand dashboards. Rather than reviewing spreadsheets manually, fleet managers receive actionable insights that highlight high-cost vehicles, underperforming routes, and maintenance risks in real time.
For transport companies operating across India—including Delhi NCR, Gurgaon, Mumbai, Bengaluru, Pune, Chennai, Hyderabad, and Ahmedabad—continuous KPI monitoring helps improve operational efficiency while maintaining profitability despite fluctuating fuel prices and transportation costs.
Manual Fleet Expense Management vs AI-Powered Fleet Cost Optimization
Many transport businesses still rely on spreadsheets, handwritten registers, and manual expense reconciliation. While these methods may work for smaller fleets initially, they become increasingly inaccurate as operations scale. AI-powered fleet management platforms automate expense tracking, provide predictive insights, and significantly reduce administrative effort.
Comparison: Traditional Fleet Expense Management vs AI-Based Fleet Analytics
| Parameter | Manual Fleet Management | AI-Powered Fleet Cost Optimization |
|---|---|---|
| Expense Recording | Manual entries prone to errors | Automatic real-time expense tracking |
| Fuel Monitoring | Based on invoices and estimates | Live fuel consumption and anomaly detection |
| Vehicle Performance | Periodic manual review | Continuous monitoring and alerts |
| Route Analysis | Historical comparison only | Real-time route optimization |
| Maintenance Planning | Reactive repairs | Predictive maintenance scheduling |
| Driver Evaluation | Limited manual observation | Automated driver scorecards |
| Reporting Speed | Hours or days | Instant dashboards |
| Cost Visibility | Limited | Complete operational transparency |
| Decision Making | Based on assumptions | Data-driven recommendations |
| Scalability | Difficult for growing fleets | Easily supports large fleets |
Business Benefits of AI-Based Fleet Expense Analysis
Organizations adopting intelligent fleet analytics typically experience improvements across multiple operational areas.
Some of the most significant advantages include:
- Reduced fuel wastage through intelligent route recommendations.
- Early detection of abnormal maintenance patterns.
- Improved trip profitability analysis.
- Better allocation of vehicles based on utilization trends.
- Faster identification of revenue leakage.
- Improved compliance reporting.
- Lower administrative workload.
- Better forecasting for fleet expansion and budgeting.
Instead of spending time collecting operational data, fleet managers can focus on improving efficiency, customer service, and overall business growth.
For companies managing fleets across multiple Indian cities, centralized AI-powered reporting ensures consistent visibility regardless of vehicle location.
A Practical Fleet Cost Optimization Strategy for Transport Companies
Reducing fleet expenses is not achieved through a single initiative. Sustainable cost optimization requires continuous monitoring, process improvement, and technology adoption across the entire transport lifecycle.
Fleet managers should develop a structured optimization framework that focuses on prevention rather than correction.
Step-by-Step Fleet Cost Optimization Framework
Step 1: Measure Current Operating Costs
Calculate total operating cost per vehicle, including:
- Fuel
- Driver expenses
- Maintenance
- Tyres
- Toll charges
- Insurance
- Documentation
- Repairs
- Depreciation
This establishes a baseline for future improvement.
Step 2: Identify High-Cost Areas
Review historical reports to determine where expenses are increasing.
Common reasons include:
- Excessive idling
- Poor route planning
- Unauthorized vehicle usage
- Frequent emergency repairs
- Low fuel efficiency
- Empty return trips
- Driver behaviour issues
- Delayed preventive maintenance
Step 3: Prioritize Improvements
Not every issue delivers the same return.
Fleet managers should prioritize initiatives that produce measurable savings quickly, such as:
- Optimizing delivery routes.
- Improving driver behaviour through coaching.
- Increasing preventive maintenance compliance.
- Reducing empty kilometres.
- Monitoring fuel theft and fuel leakage.
- Standardizing maintenance schedules.
Step 4: Monitor Results Continuously
Successful fleet optimization is an ongoing process rather than a one-time project.
Monthly dashboards should compare:
- Planned vs actual expenses.
- Fuel budget vs actual fuel consumption.
- Maintenance budget vs repair costs.
- Vehicle utilization trends.
- Driver performance improvements.
- Cost per kilometre.
- Profitability by route.
- Profitability by customer.
Regular performance reviews help organizations adapt quickly to changing fuel prices, maintenance costs, and operational demands.
For transport businesses operating across Delhi NCR, Mumbai, Bengaluru, Pune, Gurgaon, and other major logistics hubs in India, implementing a structured fleet cost optimization strategy supported by intelligent fleet management software can significantly improve operational efficiency, reduce overall transportation costs, increase fleet productivity, and strengthen long-term business profitability.
Conclusion
When we examine fleet expense analysis reports, we can see how costs are allocated to various areas such as maintenance, routine maintenance, spare parts, repairs, capital cost, and per km vehicle cost. When we check vehicle costs region-wise, we can optimize by analyzing the flow of expenses from different regions. Stay tuned for the upcoming blog on other steps of fleet manager reports.
FAQs on Fleet Cost Optimization and Fleet Expense Analysis
What is fleet analysis? ▼
Fleet analysis is one of many reports in fleet reporting. With this report, fleet managers slice up expenses incurred on the fleet in a particular quarter, 6 months or in a year and optimize least performing areas i.e. fleet maintenance, running km, driver performance, etc.
What is fleet forecasting? ▼
Fleet forecasting refers to different aspects like forecasting service reminders on X km or forecasting revenue during job planning. Forecasting fleet jobs in a traditional manner is changing with the adoption of fleet management software.
What is fleet cost optimization? ▼
Fleet cost optimization is the process of reducing avoidable fleet expenses while improving vehicle productivity, driver performance, fuel efficiency, route planning, maintenance control, and trip profitability. For fleet managers, it means understanding the actual cost per kilometre, comparing planned versus actual trip expenses, and identifying where money is being lost across fuel, tolls, maintenance, driver behaviour, tyre usage, idle time, route deviations, and empty trips.
In India, fleet cost optimization is especially important because transport businesses often operate across high-traffic and cost-sensitive corridors such as Delhi NCR, Gurgaon, Mumbai, Bengaluru, and Pune. Costs can vary widely depending on diesel prices, toll routes, FASTag deductions, state permits, driver allowances, maintenance workshops, and vehicle utilisation. A transporter running 50 vehicles may lose lakhs every month if fuel pilferage, poor route planning, tyre wear, or unplanned breakdowns are not monitored properly.
The best fleet cost optimization approach combines GPS tracking, fuel monitoring, maintenance reports, expense analytics, driver scorecards, and trip-level profitability analysis. Instead of relying only on manual records, fleet managers can use software to compare budgeted expenses with actual costs and take faster decisions. This helps businesses improve margins, reduce leakage, and build more predictable transport operations.
Why is cost optimization important for fleet managers in India? ▼
Cost optimization is important for fleet managers in India because logistics margins are often thin and even small inefficiencies can directly reduce profitability. Fleet owners deal with recurring expenses such as diesel, CNG, tolls, driver salaries, vehicle EMIs, maintenance, tyres, challans, insurance, permits, and unplanned repairs. Without a clear fleet expense analysis report, it becomes difficult to know whether a vehicle, driver, route, region, or customer contract is profitable.
In cities like Delhi, Gurgaon, Mumbai, Bengaluru, and Pune, fleet operating costs are affected by congestion, waiting time, route restrictions, toll plazas, parking costs, local compliance rules, and high service costs. For example, a truck delayed in Mumbai traffic or stuck near Delhi NCR entry points may consume more fuel, miss delivery timelines, and increase driver allowances. Similarly, frequent empty trips between industrial clusters can reduce revenue per kilometre.
For Indian transporters, the best way to control fleet expenses is to track cost per kilometre, fuel usage, maintenance patterns, driver performance, and trip-level profitability. Fleet management software helps convert raw vehicle data into actionable insights. This enables fleet managers to decide whether to use owned vehicles or market vehicles, which routes need correction, which drivers need training, and where maintenance costs are increasing. Better cost visibility leads to stronger budgeting, higher utilisation, and improved business profitability.
What are the main direct and indirect expenses in fleet management? ▼
The main direct expenses in fleet management are costs that can be linked to a specific vehicle, trip, route, driver, or shipment. These include fuel expenses, toll charges, FASTag payments, driver allowances, trip advances, challans, loading and unloading costs, route deviation costs, market vehicle charges, and miscellaneous trip expenses. Direct expenses are easier to compare because fleet managers can calculate them against kilometres travelled, revenue earned, and planned budgets.
Indirect expenses are costs that support the overall fleet operation but may not always be linked to one specific trip. These include tyre replacement, tyre scrap value adjustments, vehicle repairs, preventive maintenance, office expenses, staff salaries, documentation charges, insurance, EMIs, accidental maintenance, workshop costs, and outsourced repair expenses. These costs still affect profitability and must be tracked regularly.
For transporters in India, especially across Delhi NCR, Gurgaon, Mumbai, Bengaluru, and Pune, both direct and indirect expenses can vary by location. Maintenance costs may be higher in metro cities, toll expenses may differ by corridor, and driver allowances may increase for long-haul or high-delay routes. The best fleet expense analysis report should separate direct and indirect costs clearly so fleet managers can identify which expenses are controllable, which are recurring, and which need immediate action.
How much does fleet management software cost in India? ▼
The cost of fleet management software in India usually depends on the number of vehicles, features required, hardware needs, integrations, and the level of analytics included. Basic GPS vehicle tracking solutions may start from around ₹300 to ₹800 per vehicle per month. More advanced fleet management platforms with fuel monitoring, route planning, maintenance alerts, driver behaviour reports, expense analytics, and transport management features may range from ₹1,000 to ₹3,500 per vehicle per month or more, depending on the scope.
For larger fleet operators in Delhi NCR, Gurgaon, Mumbai, Bengaluru, and Pune, pricing may also include one-time hardware costs, installation charges, fuel sensor costs, dashcam or video telematics costs, API integrations, ERP integration, and custom reporting. Hardware such as GPS devices, fuel sensors, or telematics units may add additional upfront costs, depending on the vehicle type and operational requirements.
The best way to evaluate fleet management software price is not only by monthly subscription cost but by return on investment. If a system helps reduce fuel leakage, lower idle time, improve route planning, control maintenance, and reduce empty trips, the savings can be much higher than the software cost. Fleet managers should compare pricing against measurable benefits such as lower cost per kilometre, fewer breakdowns, improved vehicle utilisation, and better trip profitability.
What is the best way to reduce fleet expenses in Delhi NCR and Gurgaon? ▼
The best way to reduce fleet expenses in Delhi NCR and Gurgaon is to combine route planning, fuel monitoring, driver performance tracking, preventive maintenance, and trip-level expense analysis. These regions have dense traffic, multiple toll routes, industrial movement from areas such as Manesar, Faridabad, Noida, Ghaziabad, and Gurgaon, and frequent delays around entry points. Without proper planning, fleets may spend extra on fuel, waiting time, driver allowances, and route deviations.
Fleet managers should first calculate cost per kilometre for each vehicle and compare it across routes. A vehicle running between Gurgaon and Delhi may have different cost behaviour than one running between Gurgaon and Jaipur or Gurgaon and Mumbai. Reports should track planned distance versus GPS distance, fuel filled versus fuel consumed, idle time, toll deductions, maintenance frequency, and loaded versus unloaded kilometres.
To reduce costs in Delhi NCR and Gurgaon, transporters can use automated alerts for route deviation, excessive idling, harsh driving, unauthorised stoppages, and maintenance due dates. They can also identify routes where market vehicles are more cost-effective than owned vehicles. For high-volume logistics businesses, the top priority should be visibility: knowing where each rupee is spent and which vehicles, drivers, and routes are reducing margins.
How can fleet managers reduce transport costs in Mumbai, Bengaluru, and Pune? ▼
Fleet managers can reduce transport costs in Mumbai, Bengaluru, and Pune by improving route efficiency, reducing idle time, monitoring maintenance expenses, and using data-driven trip planning. These cities have high traffic density, peak-hour restrictions, industrial clusters, port or warehouse movement, and frequent last-mile delivery challenges. Mumbai fleets may face port delays, toll costs, and congestion, while Bengaluru and Pune fleets may deal with urban traffic, IT corridor movement, industrial belt movement, and high vehicle utilisation pressure.
The best approach is to track each trip from planning to closure. Fleet managers should compare estimated expenses with actual expenses, including fuel, tolls, driver allowances, repair costs, detention time, and loading or unloading delays. If one route consistently has higher costs, the reason may be traffic, poor driver behaviour, vehicle condition, wrong route selection, or low return-load availability.
Fleet software can help Mumbai, Bengaluru, and Pune transporters by showing real-time vehicle location, route deviation alerts, fuel reports, maintenance reminders, driver scorecards, and cost-per-kilometre dashboards. For businesses with frequent city-to-city movement, analytics can also show whether owned vehicles or leased/market vehicles are more profitable. This helps fleet managers reduce wastage, improve delivery reliability, and protect margins in competitive logistics markets.
How does fleet expense analysis improve profitability? ▼
Fleet expense analysis improves profitability by showing where money is being spent, where losses are happening, and which vehicles or routes are generating better returns. Instead of looking only at total monthly expenses, fleet managers can break costs down by vehicle, driver, route, region, trip, customer, and vehicle model. This makes it easier to find high-cost areas such as excess fuel consumption, frequent breakdowns, poor driver performance, empty kilometres, high toll routes, or unplanned repairs.
For example, if two trucks travel the same route but one has a higher cost per kilometre, the fleet manager can investigate fuel usage, driver behaviour, odometer readings, GPS distance, tyre condition, maintenance history, and route adherence. Similarly, if a certain region has lower profitability, the business can check whether freight rates, toll costs, market vehicle dependency, or return-load availability are affecting margins.
In India, where transport businesses operate across complex routes between Delhi, Gurgaon, Mumbai, Bengaluru, Pune, and other logistics hubs, expense analysis helps improve pricing and planning. It supports better budgeting, customer contract evaluation, vehicle replacement decisions, driver incentive planning, and maintenance scheduling. The top benefit is faster decision-making: fleet managers can move from assumptions to data-backed action and improve net profit over time.
What features should the best fleet cost optimization software include? ▼
The best fleet cost optimization software should include features that help fleet managers monitor, compare, and reduce expenses across the complete transport operation. At a minimum, it should offer GPS vehicle tracking, route planning, fuel monitoring, trip expense tracking, maintenance alerts, driver behaviour reports, vehicle utilisation reports, cost-per-kilometre analysis, and planned versus actual expense comparison.
For Indian fleet operators, the software should also support FASTag and toll expense visibility, diesel or CNG consumption reports, vehicle model-wise analysis, driver-wise performance, loaded and unloaded trip tracking, market vehicle comparison, and region-wise profitability reports. These features are especially useful for logistics businesses operating in Delhi NCR, Gurgaon, Mumbai, Bengaluru, Pune, and long-haul transport corridors.
Important features to look for include:
- Real-time vehicle location and route deviation alerts
- Fuel consumption, fuel theft, and mileage reports
- Preventive maintenance and repair cost tracking
- Driver scorecards and performance benchmarking
- Trip-wise budget versus actual expense reports
- Dashboards for cost per kilometre and vehicle profitability
A good platform should help fleet managers not just collect data but convert it into clear decisions. The top software solutions make it easier to reduce leakage, improve utilisation, and manage fleet expenses at scale.
How can small and mid-sized transporters control fleet operating costs? ▼
Small and mid-sized transporters can control fleet operating costs by starting with the most important expense areas: fuel, maintenance, driver performance, tyres, tolls, and empty trips. Even if a business has only 10 to 50 vehicles, small cost leakages can become significant over time. A structured fleet expense report helps owners understand whether each vehicle is earning enough revenue compared to its running and maintenance cost.
The first step is to calculate cost per kilometre for every vehicle. This should include fuel, tolls, driver allowance, repairs, tyres, documentation, EMI, insurance, and other recurring expenses. The second step is to compare planned routes with actual GPS distance. If drivers take longer routes, idle excessively, or make unauthorised stops, the fuel and time cost increases. The third step is to monitor preventive maintenance because delayed servicing often leads to expensive breakdowns.
For transporters in India, especially those operating around Delhi NCR, Gurgaon, Mumbai, Bengaluru, and Pune, affordable fleet software can be a practical investment. Basic tracking may cost less, while advanced analytics may cost more, but the best value comes from reducing fuel loss, improving delivery reliability, and increasing vehicle utilisation. With the right reports, smaller transport businesses can compete better with large fleet operators.