
Ready to steer your fleet into the future? Navigate with us through this narrative and unlock the potential that awaits.
Dive into Fleetx's Transporter Analytics. Think of it as your roadmap to success, guiding you to smarter choices, clearer insights, and brighter horizons. With dimensions like Distance, Detentions, Deviations, Disconnections, Driving Score, and Delays—often referred to as the "6Ds"—you're equipped with a comprehensive dashboard that elevates transportation strategies towards efficiency and sustainability.
At its essence, Transporter Analytics serves as an integrated dashboard, amalgamating vast pools of data to provide actionable insights. By harnessing the power of data analytics and intelligent algorithms, it empowers businesses to refine their transportation strategies, ensuring optimal resource allocation and maximized operational efficiency.
A Game-Changer for Shippers, Transporters, and 3PLs
Fleetx's Transporter Analytics—a tool designed to cater to a diverse range of stakeholders in the logistics ecosystem.
Shippers, encompassing manufacturers, retailers, distributors, and wholesalers, can now leverage this tool to rate and reward commendable transporter practices. With the ability to compare transporters across their fleet, shippers gain a competitive edge, ensuring they collaborate with only the best in the business.
Third-party logistics (3PL) organizations stand to benefit immensely. With detailed analytics at their disposal, 3PLs can provide targeted consultation and training, guiding erring transporters towards improved logistics experiences. This hand-holding approach not only reduces deviations and detentions but also significantly enhances the Turnaround Time (TAT) and reduce Operating Costs.
But the true power of Transporter Analytics shines in its application for transporters involved in market hire vehicle operations. With unparalleled visibility into detailed analytics—ranging from historical improvements to detention analysis—transporters can continuously refine their operations. Moreover, the system's transparency and accountability are unmatched. Each score can be drilled down to individual jobs, ensuring that every rating is backed by concrete data.
Unlocking the Potential of Transporter Analytics
For Shippers: Optimizing Logistics with Transporter Analytics
Fleetx's Transporter Analytics is a game-changing tool designed to cater to the diverse needs of shippers, including manufacturers, retailers, distributors, and wholesalers. This powerful tool empowers shippers to assess and incentivize exceptional transporter practices. It enables shippers to compare different transporters within their fleets, giving them a competitive edge and ensuring they partner with the best in the industry. This, in turn, leads to increased efficiency and reliability in their logistics operations.
For Transporters: Empowering Transporters for Excellence
Transporters involved in market hire vehicle operations can benefit significantly from Transporter Analytics. This tool provides them with unprecedented insights into their operations, including comprehensive analytics covering historical performance improvements and detention analysis. The system's transparency and accountability allow for a detailed examination of every score, down to individual jobs, backed by concrete data. This level of scrutiny equips transporters with the tools they need to continually refine their operations, optimize efficiency, and enhance their competitiveness in the market.
For Third-Party Logistics (3PL) Organizations: Elevating 3PL Services with Transporter Analytics
Third-party logistics (3PL) companies stand to gain substantial benefits from Transporter Analytics. With detailed analytics at their disposal, 3PLs can offer targeted consultation and training to transporters, guiding them toward improved logistics practices. This consultative approach helps reduce deviations, minimize detentions, and significantly improve Turnaround Time (TAT), all while reducing operational costs. By using this tool, 3PLs enhance their advisory services to transporters, building stronger partnerships and more efficient logistics operations.
User Interface and Dashboard
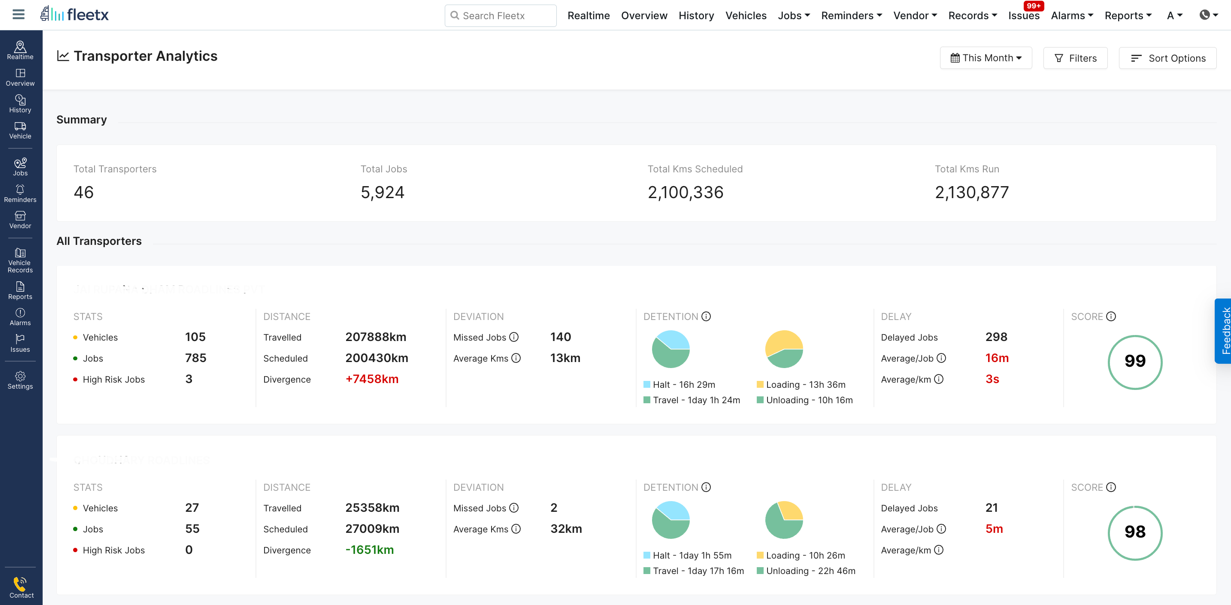
Our platform offers user-friendly filters and sorting tools for effortless navigation through extensive datasets. Fleet managers seeking to optimize vehicle deployment can use every data point to their advantage. Similarly, logistics executives focused on reducing delivery delays benefit from our structured and easy-to-understand data presentation. Additionally, comparative metrics enhance the platform's capabilities, enabling comprehensive analysis for informed decision-making. This is just the start – as we introduce the Transporter Analytics platform, we invite you to explore its features, delve into metrics, and experience its transformative impact on your operations.
Key Metrics (The 6Ds):
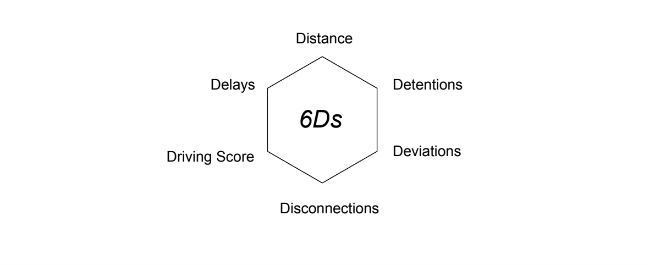
- Distance: A precise measurement of vehicular travel, enabling businesses to optimize routes and reduce fuel consumption.
- Detentions: Detailed tracking of unforeseen stops or delays, providing insights into potential bottlenecks or areas of improvement in the supply chain.
- Deviations: Real-time monitoring of vehicular deviations from planned routes, ensuring adherence to logistical plans/routes and timely deliveries.
- Disconnections: Advanced tracking of vehicle communication downtimes, ensuring continuous data flow and immediate troubleshooting with transporter for any connectivity issues.
- Driving Score: A comprehensive evaluation of driver performance, based on various parameters, ensuring safety standards are upheld by transporters’ drivers and identifying areas for training or improvement.
- Delays: Analytical insights into delivery timelines, enabling businesses to enhance punctuality and customer satisfaction.
Basic KPIs & Use Cases
1. Basic KPIs
- Fleet Utilization: ABC Logistics achieved a 75% fleet utilization rate in April.
- Operations Growth: XYZ Transporters saw a 20% increase in jobs executed in Q1.
- Security Vulnerabilities: 6% of jobs were high-risk due to device tampering/unknown stoppage in March.
2. Distance Metrics:
- Traveled Distance: DEF Logistics' fleet covered 50,000 kilometers last month.
- Scheduled Distance: GHI Transport scheduled 10,000 kilometers for the last week.
- Divergence: JKL Freight observed a 500-kilometer divergence last month.
3. Deviation Metrics:
- Missed Jobs: MNO Transporters missed 10 out of 300 jobs in February.
- Average KMs Deviation: PQR Logistics had an average deviation of 15 kilometers in deliveries.
4. Detention Metrics:
- Halt Time: STU Carriers reported a 2-hour average halt time at customer geofences.
- Travel Time: VWX Transport spent 5 hours traveling outside geofences per job.
- Loading Time: ZYX Freight had a 3-hour average loading time.
- Unloading Time: ABC Freight had a 2-hour average unloading time.
5. Delay Metrics:
- Delayed Jobs: ABCD Logistics had 20 out of 200 jobs delayed in March.
- Average Delay/Job: EFGH Transporters reported a 30-minute average delay per job in Q1.
- Average Delay/KM: IJKL Carriers had a 2-minute average delay per kilometer in February.
6. Driving Score:
- Score: LMNO Transport achieved an average score of 95 out of 100 in February, indicating safe driving practices.
These metrics provide insights and actionable items for optimizing various aspects of transportation and logistics operations.
Conclusion
In today's rapidly evolving transportation landscape, data is the cornerstone of progress. A glance at the global logistics market projections suggests its value is poised to surpass $23 trillion by 2035. With such vast operations, even minute inefficiencies can lead to substantial financial implications. For instance, a mere 1% operational inefficiency could result in billions of potential revenue losses. Embracing tools like Fleetx's Transporter Analytics becomes not just beneficial but essential. By harnessing the power of data, stakeholders can achieve enhanced operational efficiencies, reduced costs, and improved delivery timelines, ensuring they remain competitive in this expansive and dynamic market.
Frequently Asked Questions
What is transporter analytics, and why is it becoming essential for modern logistics businesses? ▼
Transporter analytics is a data-driven approach that helps businesses evaluate transporter performance using operational metrics such as trip completion, delays, detention time, route deviations, fleet utilization, driving behaviour, delivery performance, and overall transportation efficiency. Instead of relying on manual reports or assumptions, organizations gain measurable insights that help improve logistics planning, reduce operational costs, and make informed decisions about transporter selection and performance.
For manufacturers, distributors, retailers, shippers, transporters, and third-party logistics (3PL) providers, transporter analytics creates transparency across the supply chain. Businesses can compare transport partners, identify recurring operational bottlenecks, monitor historical performance, and take corrective actions before issues impact customers. Analytics also supports better collaboration by providing objective performance data rather than subjective evaluations.
Across India, especially in logistics hubs such as Delhi, Delhi NCR, Gurgaon, Mumbai, Bengaluru, and Pune, companies increasingly depend on transporter analytics to manage growing shipment volumes and rising customer expectations. Instead of only tracking vehicles, businesses can analyse detention trends, delivery delays, route compliance, turnaround time (TAT), and driver performance from a centralized dashboard.
Key benefits include:
- Improved transporter performance evaluation.
- Better shipment visibility.
- Reduced detention and delays.
- Improved fleet utilization.
- Lower transportation costs.
- Higher customer satisfaction.
- Data-driven decision making.
- Continuous operational improvement.
As digital supply chains continue evolving, transporter analytics is becoming an important capability for organizations looking to improve efficiency, reduce costs, and strengthen long-term transportation partnerships.
How does transporter analytics improve transportation efficiency for shippers, transporters, and 3PL companies? ▼
Transporter analytics helps every participant in the logistics ecosystem make smarter operational decisions by converting transportation data into measurable business insights. Rather than focusing only on GPS tracking, modern analytics platforms evaluate key performance indicators (KPIs) that directly influence cost, productivity, service quality, and operational efficiency.
For shippers, analytics enables objective transporter comparison based on delivery performance, detention time, delay frequency, route adherence, and driving behaviour. This allows procurement teams to reward high-performing transporters while identifying vendors requiring operational improvements.
Transporters benefit by gaining visibility into fleet utilization, historical performance, turnaround time, deviations, and operational inefficiencies. These insights support continuous improvement and help increase profitability without necessarily expanding fleet size.
Third-party logistics (3PL) companies can use transporter analytics to provide consultative services, improve planning, reduce bottlenecks, and strengthen relationships with both customers and transport partners.
Organizations operating across Delhi, Gurgaon, Mumbai, Bengaluru, Pune, and other industrial corridors often manage thousands of shipments each month. Centralized analytics enables operations teams to monitor performance across multiple transporters, branches, and customer locations from one dashboard.
Major operational improvements include:
- Reduced delivery delays.
- Lower detention costs.
- Improved transporter accountability.
- Better route compliance.
- Higher fleet productivity.
- Improved customer service levels.
- Faster operational reporting.
- Improved long-term transportation planning.
Instead of reacting after problems occur, businesses can proactively optimize transportation performance using real-time operational intelligence.
What are the best transporter analytics software solutions for logistics companies in India? ▼
The best transporter analytics software depends on fleet size, shipment volume, operational complexity, and reporting requirements. While many logistics platforms offer tracking capabilities, leading transporter analytics solutions combine operational intelligence, transportation KPIs, benchmarking, historical reporting, and real-time dashboards into one integrated platform.
Businesses evaluating top transporter analytics software should prioritize capabilities rather than focusing solely on brand names. A comprehensive platform should provide actionable insights that help improve transportation efficiency and reduce operating costs.
Important features include:
- Transporter performance scorecards.
- Real-time shipment monitoring.
- Fleet utilization analytics.
- Detention and delay analysis.
- Route deviation monitoring.
- Driving behaviour analytics.
- Historical trend reporting.
- Custom KPI dashboards.
- Role-based reporting.
- Integration with Transport Management Systems (TMS), ERP platforms, and telematics solutions.
Organizations operating across Delhi NCR, Gurgaon, Mumbai, Bengaluru, Pune, Chennai, and Hyderabad generally prefer scalable cloud-based transporter analytics platforms that support multiple warehouses, transport partners, and customer locations. The right solution should not only help identify operational inefficiencies but also improve collaboration between shippers, transporters, and 3PL providers. Businesses that adopt analytics-driven logistics management often achieve better transporter selection, improved turnaround time, enhanced visibility, and more predictable transportation performance over the long term.
How much does transporter analytics software cost in India, and what factors influence implementation pricing? ▼
The cost of implementing transporter analytics software in India depends on several factors, including fleet size, shipment volume, number of transport partners, software features, integrations, deployment model, and support requirements. Rather than evaluating only the subscription price, businesses should assess the total value generated through improved transporter performance, reduced delays, optimized fleet utilization, and lower operational costs.
Small and medium-sized businesses typically invest in cloud-based solutions that require minimal infrastructure, while large enterprises often require customized implementations integrated with ERP, Transport Management Systems (TMS), Warehouse Management Systems (WMS), and telematics platforms.
As a general estimate, organizations may expect:
- Small businesses: approximately ₹2,000–₹8,000 per vehicle for initial hardware (where required) along with a monthly SaaS subscription.
- Medium-sized logistics companies: implementation costs generally depend on the number of users, transporters, integrations, and reporting modules.
- Large enterprises: customized enterprise pricing based on operational complexity, multiple business units, API integrations, analytics dashboards, and implementation scope.
Companies operating in Delhi, Delhi NCR, Gurgaon, Mumbai, Bengaluru, Pune, and other logistics hubs should compare vendors based on scalability, customer support, reporting capabilities, implementation experience, security, and long-term return on investment rather than selecting the lowest-cost solution. A well-implemented transporter analytics platform often reduces transportation costs, improves service quality, and enables data-driven logistics management that delivers measurable savings over time.
Why are businesses in Delhi, Gurgaon, and Mumbai increasingly adopting transporter analytics platforms? ▼
Delhi NCR, Gurgaon, and Mumbai are among India's busiest transportation and distribution corridors, supporting manufacturing, e-commerce, FMCG, retail, automotive, pharmaceuticals, and industrial logistics. Businesses operating in these regions often coordinate hundreds or thousands of daily shipments involving multiple transporters, warehouses, and delivery locations. Managing this complexity manually can lead to delays, higher transportation costs, inconsistent transporter performance, and reduced operational visibility.
Transporter analytics platforms provide centralized dashboards that help logistics managers monitor key operational KPIs across every shipment and transporter. Instead of waiting for monthly reports, businesses gain access to near real-time insights that support faster operational decisions and continuous performance improvement.
Companies adopt transporter analytics to:
- Compare transporter performance objectively.
- Reduce detention and turnaround time.
- Improve route compliance.
- Monitor delays proactively.
- Increase fleet utilization.
- Improve shipment visibility.
- Strengthen vendor accountability.
- Optimize transportation planning across multiple locations.
For organizations managing supply chains throughout Delhi NCR, Gurgaon, Mumbai, Bengaluru, Pune, Chennai, and Hyderabad, transporter analytics also simplifies collaboration between procurement, logistics, operations, and transporter partners. By replacing fragmented reporting with standardized performance metrics, businesses can improve customer satisfaction, reduce logistics costs, and establish stronger long-term transportation partnerships that support business growth.
Which industries benefit the most from transporter analytics and logistics performance dashboards? ▼
Transporter analytics is valuable across virtually every industry that depends on commercial transportation, but organizations with large shipment volumes, multiple transport partners, or complex distribution networks typically realize the greatest benefits. By measuring transporter performance consistently, businesses can improve operational efficiency while reducing transportation-related costs.
Industries that benefit significantly include:
- Manufacturing for monitoring inbound and outbound transportation performance.
- Retail and e-commerce where delivery speed directly influences customer satisfaction.
- FMCG distribution requiring high shipment frequency and route optimization.
- Automotive logistics with time-sensitive production schedules.
- Pharmaceutical and healthcare logistics where delivery reliability is critical.
- Cold chain logistics requiring strict transportation monitoring.
- Mining and construction operating large commercial fleets.
- Third-party logistics (3PL) providers managing multiple transport vendors.
Across India's major logistics hubs—including Delhi, Delhi NCR, Gurgaon, Mumbai, Bengaluru, Pune, Ahmedabad, and Chennai—organizations increasingly deploy transporter analytics to evaluate transport partners using standardized KPIs such as delay percentage, detention duration, driving score, route deviations, fleet utilization, and delivery performance. This analytical approach enables businesses to improve vendor selection, strengthen transportation planning, enhance operational transparency, and continuously optimize logistics operations while maintaining higher service levels for customers.
How can shippers use transporter analytics to select and manage the best transport partners? ▼
Selecting a transporter solely on freight rates often leads to hidden operational costs such as delayed deliveries, route deviations, vehicle detentions, poor communication, and inconsistent service quality. Transporter analytics helps shippers evaluate transport partners using objective operational KPIs instead of relying on assumptions or historical relationships.
By monitoring measurable performance indicators, businesses can compare transporters fairly across different routes, customers, and shipment categories. This creates accountability while encouraging transport partners to improve operational performance continuously.
Important metrics that shippers should evaluate include:
- On-time delivery percentage.
- Average detention time.
- Trip completion rate.
- Route deviation frequency.
- Driver safety and driving score.
- Fleet utilization efficiency.
- Turnaround Time (TAT).
- Historical performance trends.
- Customer complaint frequency.
- Cost per shipment versus service quality.
Large manufacturers and distributors operating in Delhi NCR, Gurgaon, Mumbai, Bengaluru, Pune, and other industrial corridors often work with dozens of transport companies simultaneously. Transporter analytics enables procurement and logistics teams to benchmark transporter performance, identify high-performing partners, reward consistent service, and support data-driven contract renewals. Over time, this results in lower transportation costs, improved delivery reliability, stronger customer satisfaction, and a more resilient supply chain built around measurable operational excellence rather than subjective decision-making.
What KPIs should businesses monitor in a transporter analytics dashboard? ▼
An effective transporter analytics dashboard should provide more than shipment tracking. It should measure operational efficiency through clearly defined Key Performance Indicators (KPIs) that help businesses identify bottlenecks, benchmark transporters, and improve logistics performance over time. Selecting the right KPIs enables organizations to make informed operational and strategic decisions while improving customer service.
Although KPI selection varies by industry, most organizations should monitor a combination of transportation, operational, and driver performance metrics.
Recommended KPIs include:
- Fleet utilization rate.
- On-time delivery percentage.
- Average Turnaround Time (TAT).
- Average detention duration.
- Route deviation percentage.
- Distance travelled versus planned distance.
- Delivery delay frequency.
- Driving behaviour score.
- Trip completion rate.
- Vehicle disconnection incidents.
- Average transportation cost per shipment.
- Transporter performance score.
Businesses managing logistics operations across India, particularly in Delhi, Gurgaon, Mumbai, Bengaluru, Pune, Chennai, and Ahmedabad, increasingly use centralized KPI dashboards to monitor multiple transporters simultaneously. Standardized reporting simplifies vendor management, improves operational transparency, reduces manual reporting effort, and supports continuous improvement initiatives. By tracking performance consistently, organizations can improve efficiency, reduce logistics costs, and build stronger long-term transportation partnerships.
Can transporter analytics improve supply chain performance for small and medium businesses in India? ▼
Yes. Transporter analytics is no longer limited to large enterprises. Cloud-based logistics platforms have made advanced analytics affordable and accessible for small and medium-sized businesses (SMBs), allowing them to improve transportation efficiency without investing in expensive infrastructure. Even companies managing a modest fleet or working with a handful of transport partners can benefit from data-driven decision-making.
Instead of manually reviewing spreadsheets or transporter invoices, SMBs can monitor operational performance through dashboards that provide actionable insights into delivery reliability, transporter efficiency, delays, and shipment trends.
Small businesses can use transporter analytics to:
- Compare transporter performance objectively.
- Reduce avoidable transportation costs.
- Improve delivery timelines.
- Monitor detention and delays.
- Identify inefficient transport routes.
- Strengthen customer service levels.
- Improve transporter accountability.
- Support future business expansion using historical performance data.
Growing businesses across Delhi, Delhi NCR, Gurgaon, Mumbai, Bengaluru, Pune, Jaipur, and Ahmedabad increasingly adopt transporter analytics to compete with larger enterprises by improving operational efficiency rather than simply increasing fleet size. As shipment volumes grow, historical analytics becomes an important planning tool that helps businesses forecast demand, optimize transporter selection, and create scalable logistics operations capable of supporting long-term business growth.
Why is transporter analytics becoming one of the top logistics technology investments for Indian businesses? ▼
Transportation is one of the largest operational expenses for manufacturers, distributors, retailers, and logistics providers. Rising fuel prices, increasing customer expectations, complex distribution networks, and greater demand for supply chain visibility have made operational intelligence more valuable than ever. As a result, transporter analytics has become one of the top technology investments for businesses looking to improve transportation performance while maintaining profitability.
Unlike traditional reporting tools, transporter analytics provides continuous visibility into transporter performance, delivery timelines, route adherence, fleet productivity, and operational efficiency. This enables organizations to identify issues before they affect customers and implement corrective actions using measurable performance data.
Businesses investing in transporter analytics often achieve:
- Improved transporter selection.
- Lower transportation costs.
- Reduced delays and detention.
- Higher fleet utilization.
- Better shipment visibility.
- Improved customer satisfaction.
- Greater operational transparency.
- Data-driven logistics planning.
- Higher return on transportation investments.
Across Delhi NCR, Gurgaon, Mumbai, Bengaluru, Pune, Hyderabad, Chennai, and other major logistics markets, organizations are increasingly integrating transporter analytics with Transport Management Systems (TMS), ERP software, GPS tracking, and telematics platforms. Rather than treating analytics as an optional reporting tool, businesses now view it as a strategic capability that supports continuous improvement, stronger transporter partnerships, smarter logistics planning, and long-term supply chain resilience.